Spring Boot Reactive API Part 2
Spring Boot Reactive: Improving CPU bound performance using Scheduler
In part 1, we have seen that Spring Boot Reactive doesn't really improve performance if the WAITING time is CPU bound / CPU intensive tasks. This article show a quick way on how we can improve the speed through specific configuration
Setup
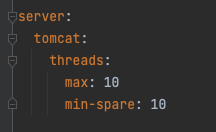
- Spring Boot's embedded Tomcat is reconfigured to only use 10 worker threads, this way we can clearly see the performance limitation and tweaks.
- Gatling is configured to simulate 30 concurrent requests with 30000 milliseconds request timeout.
- APIs internal process is calling java native code that calculate the value of PI over 1 million iterations
Default / No scheduler
The main reason why CPU bound tasks do not improve (or even degrade) with high parallelism is because of the costly overhead for context switching in the low level. In the scenario below, 10 main threads are all being used to calculate PI values and because there are less CPU than threads, a lot of context switching overhead happens:
@GetMapping(path = "calcpireactive", produces = MediaType.APPLICATION_JSON_VALUE)
public Mono<Result> calcPiReactive(@RequestParam Long itr) throws Exception {
  return studentService.calculatePiReactive(itr, createResultObject());
}
public Mono<Result> calculatePiReactive(final Long iterations, Result result) {
  return Mono.just(iterations).map(i -> {
        result.setPiResult(calcPi(i));
        return result;
      });
}
As we can see from the gatling report above and logging below, the first 10 requests are all executed in parallel, after an average of 11 seconds spent on processing and sending responses, the second 10 requests are executed. When the last 10 requests are executed they failed because the 30s timeout has been exceeded
Parallel Scheduler with Parallelism of 4
Now if instead of using the default Tomcat threads, we use a separate Scheduler with parallelism of 4 (laptop with 4 cores hyperthreaded), the service responds better as we can see below:
private final Scheduler scheduler = Schedulers.newParallel("np", 4);
public Mono<Result> calculatePiReactive(final Long iterations, Result result) {
  return Mono.just(iterations).map(i -> {
        result.setPiResult(calcPi(i));
        return result;
      }).subscribeOn(scheduler);
}
As we can see from the gatling report above and the logging below, none of the requests are getting blocked by the Tomcat's 10 threads limitation. In addition, the scheduler with parallelism of 4 minimizes the amount of context switching by trading off with letting the remaining tasks to "wait" until there is an available thread in the ExecutorService which is evident from the ever increasing duration in the log below.
Parallel Scheduler with Parallelism of 2
Bonus, apparently in my laptop, using parallelism of 2 instead of 4 achieves better average processing time (2853ms vs 5375ms) I suspect it might be because of hyperthreading, but unfortunately I'm not hardware guru.
And here's the log, we can see that the last request to be processed received its response in 4.5s, definitely better than 30s (in the case of default / no scheduler), and this is all using the same laptop and same setup!
Conclusion
In summary, without a custom scheduler, Spring WebFlux is tied to the default Tomcat's threads and prone to being blocked and timed out by the CPU bound / intensive processes. The custom scheduler creates a different ExecutorService that queued and executes tasks on its own time. Ultimately this kind of configuration vary depending on each hardware and therefore needs different adjustment on case by case basis.


Comments
Post a Comment